Originally posted on the Evil Martians Chronicles Blog
Recently, I’ve been working on optimizing performance for one of Evil Martians clients' applications. This Rails app has a dashboard that lists all resources. Every resource is an ActiveRecord model that embeds a lot of relationships, so the dashboard displays them as well. In some cases, the chaining level was up to 5 objects, like account.owner.company.tags.first.
As you may guess, the biggest bottleneck with this page was the huge number of database queries. Some of the tables used in these queries had missing indexes. Almost all models have caused N+1 queries. Since the dashboard has lots of conditions and filters as well, it wasn’t easy to detect problematic queries and then find what line of code triggered the query.
In classical MVC frameworks, the Controller layer is always responsible for fetching the data from a model. But Rails models are "lazy". When you do @user = User.find(1) in the controller and then call @user.account.title in the view, the actual account data will be retrieved from the View layer! Isn’t that against the MVC rules?
But this is how modern Rails versions work. It is a trade-off that we have to pay to have efficient models and lazily executed database queries.
In my example, the dashboard was built using lots of partials, and this made finding out the source of a heavy query really tricky. When making optimizations, I had to change the code, reload the page in a browser and then go back to Terminal where I could see the Rails log, and make conclusions about whether or not my change did help (and why the query was triggered at all from some weird partial).
Later I found the active_record_query_trace gem made by Cody Caughlan. The gem helps to find out where the query was triggered by printing the trace:
{% highlight ruby %}
IntuitAccount Load (1.2ms) SELECT “intuit_accounts”.* FROM “intuit_accounts” WHERE “intuit_accounts”.”user_id” = 20 LIMIT 1
Called from:
app/views/users/edit.html.haml:78:in block in _app_views_users_edit_html_haml___1953197429694975654_70177901460360’ app/views/users/edit.html.haml:16:in _app_views_users_edit_html_haml___1953197429694975654_70177901460360’
{% endhighlight %}
The gem helped me a lot. But I still had to switch between the browser and the Terminal with Rails log and scroll through the log, because query traces made the log quite huge.
I've spent a lot of time figuring out where ActiveRecord chains were called and tracing problematic queries. That is why I've made a special logger to simplify this process.
At some point, I realized that if I only use the latest request entry from the log, then maybe I can limit the log to avoid scrolling. I also wished that I have a better formatting of queries and traces. I decided to try saving the last log entry to public/last_request_log.html, which I could open in the next tab to the project and watch the query details right in the browser.
After an hour of coding here is what I’ve got:
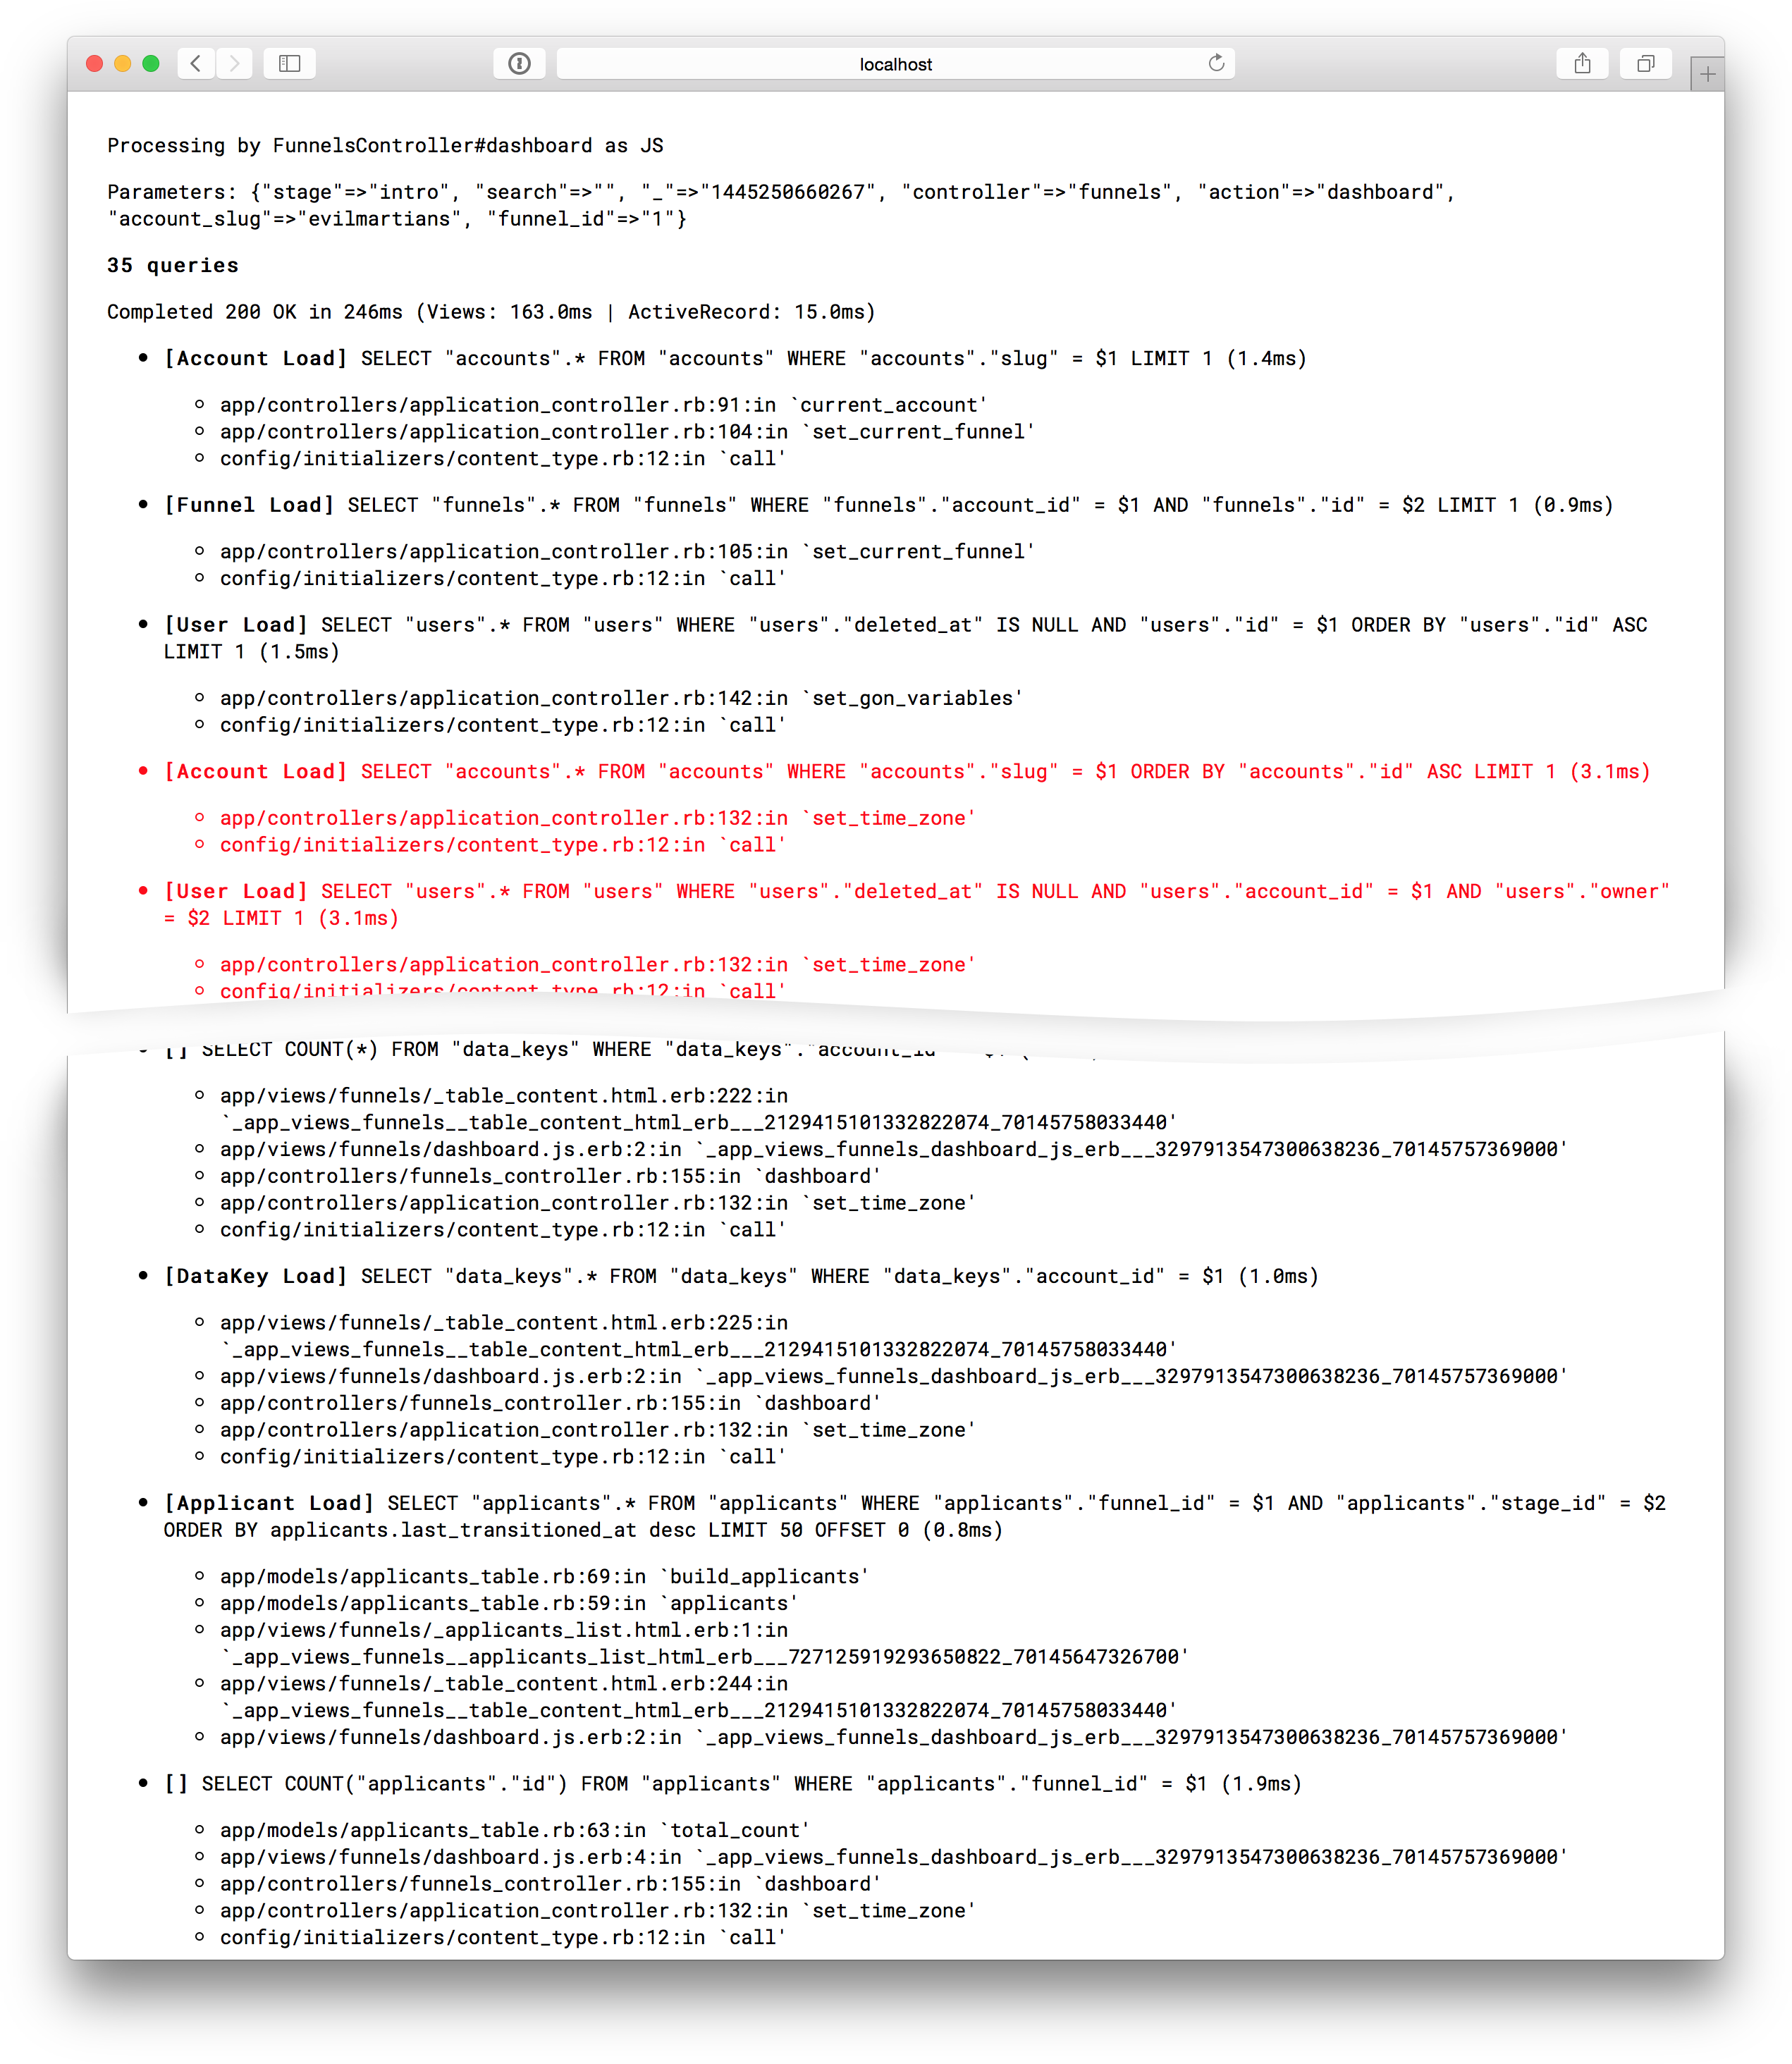
The beginning of the log entry is in exactly the same format that you have in Rails log. It displays the controller and action, format, params and response code. The next part is all about queries: it shows the query body and traces for every item. Queries that are longer than average are highlighted with red.
While it may look very simplistic, this tool saved me a ton of time and visualized what was happening through the full MVC stack.
You can also try some other tools like rack-mini-profiler that injects a tiny block to your app layout with some statistics about the queries. Or if you need to go lower level, try stackprof, the Ruby call-stack profiler.
Later, I am going to write how I optimized that page using this logger. Some spoilers: I will show how to detect N+1 queries on the early stage and why getting rid of ActiveRecord objects in view layer is a good idea.
