Finding out why a particular spec is slow might be tricky. Thanks to Aman Gupta, we have stackprof - a sampling call-stack profiler for ruby 2.1+.
I have used it a lot while working on RubyBench and finding slow parts of code in Rails stack, but never in specs. Yesterday I had to find out why my RSpec example was slow and I wrote this snippet:
{% highlight ruby %}
spec/spec_helper.rb
RSpec.configure do |config| config.around(:each) do |example| path = Rails.root.join(“tmp/stackprof-cpu-test-#{example.full_description.parameterize}.dump”) StackProf.run(mode: :cpu, out: path.to_s) do example.run end end end {% endhighlight %}
This snippet profiles every example block in your test file and saves the dump into tmp/, for instance tmp/stackprof-cpu-test-posts-controller-get-works.
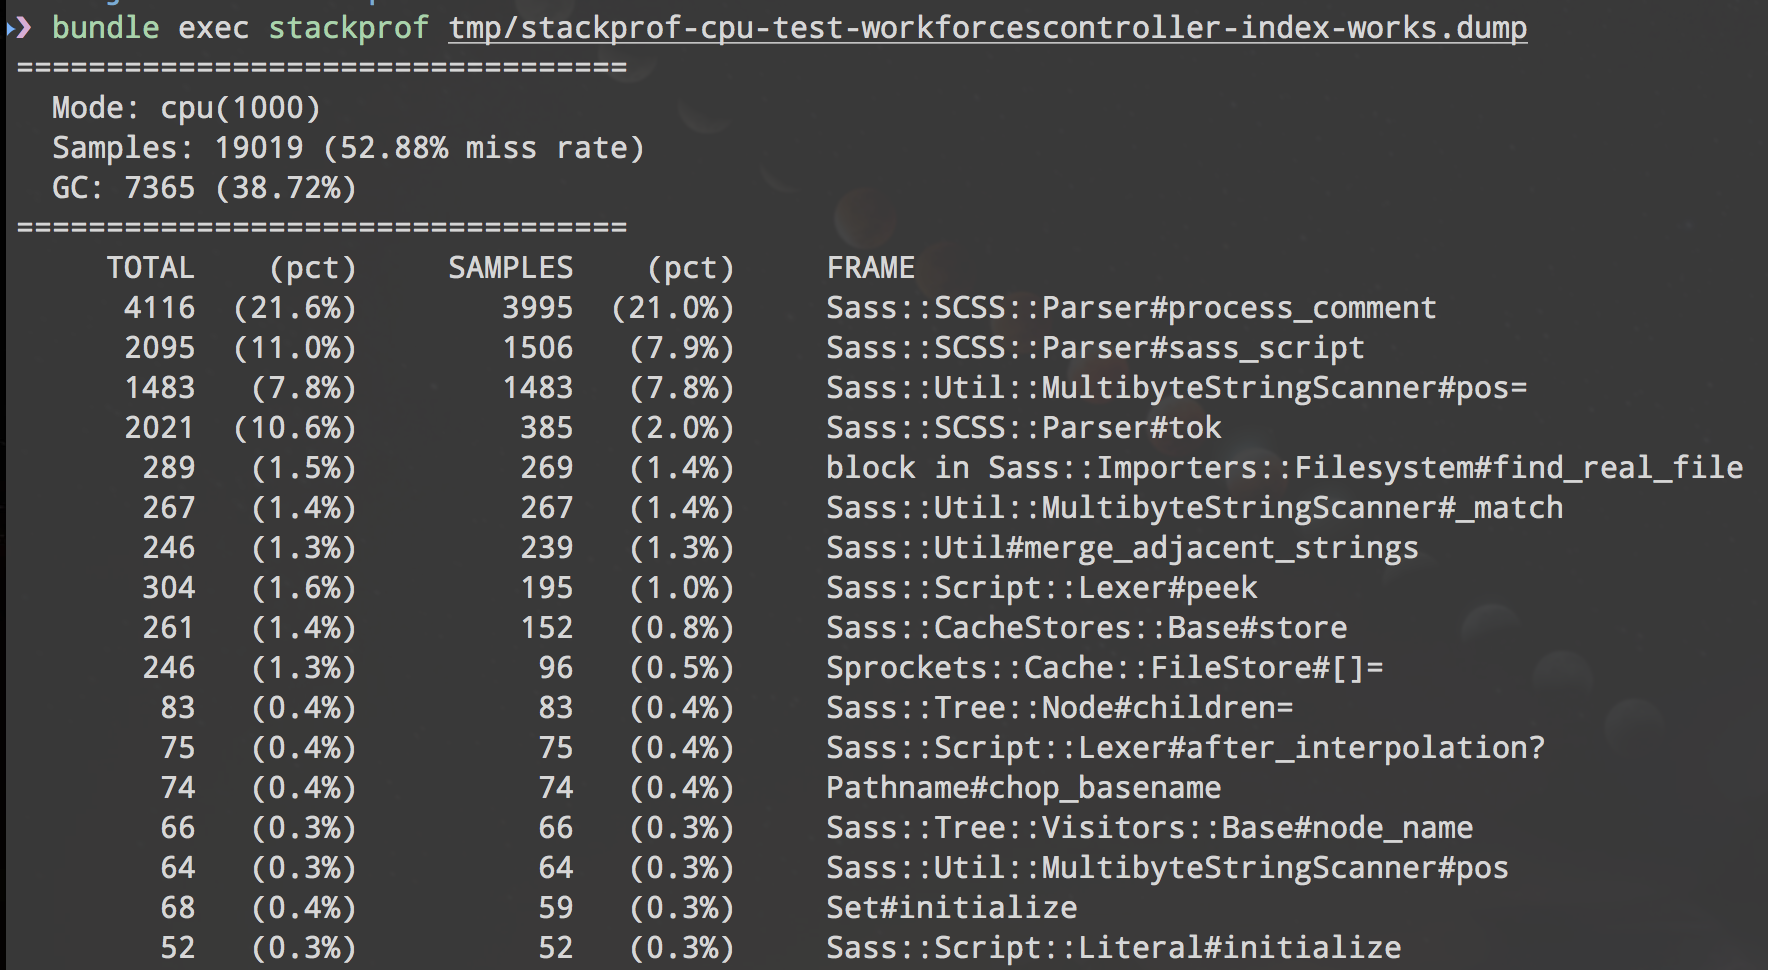
Later, you can use bundle exec stackprof to analize the dump.
In my case, stackprof helped me to realize that most of the time in specs was spent on SASS compilation:
Happy debugging!
NB: you do not need to keep the profiling enabled all the time. Use the snippet only when you need to debug a specific case.