Debugging non-containerized apps in production is dead easy: ssh to a host, rbspy, strace or gdb the process or run rails console to reproduce something in production.
Why Kubernetes makes it harder?
Running a process in a container makes debugging a bit harder: you need to first get into the container with docker exec (and don't forget to add --interactive --tty) and only inside the container you'll be able to inspect the running process.
What about using rbspy in Docker? That's even trickier, because the ptrace (a system call that rbspy relies on) is not allowed by default in a container. You'll have to run the container with --cap-add=SYS_PTRACE flag, and only then you'll be able to docker exec into it and use rbspy.
Tips
Now, let's move on to Kubernetes tips. I wrote this post as a collection of snippets that I use every day when I need to get into a running Ruby process and see what's happening.
$ kubectl get pods
NAME                         READY     STATUS    RESTARTS   AGE
secretland-c796bf9df-gmt97   1/1       Running   0          13d
secretland-4a145b44d-6xw11   1/1       Running   0          13d
I have two replicas of the secretland app that I've built in the previous post.
Let's get in to container:
$ kubectl exec -i -t secretland-c796bf9df-gmt97 /bin/bash
root@secretland-c796bf9df-gmt97:/app# ls
Dockerfile  Gemfile  Gemfile.lock  README.md  Rakefile  app  bin  config  config.ru  db  lib  log  package.json  public  script  storage  test  tmp  vendor
root@secretland-c796bf9df-gmt97:/app# bin/rails console
Loading production environment (Rails 5.2.0.rc2)
irb(main):001:0>
Or exec to Rails console directly:
$ kubectl exec -i -t secretland-c796bf9df-gmt97 /app/bin/rails console
Loading production environment (Rails 5.2.0.rc2)
irb(main):001:0>
Rbspy
Rbspy is a sampling profiler for Ruby programs that was recently released by Julia Evans. Rbspy is an awesome tool that we've been missing in the Ruby world for years, and it makes me so happy that Julia worked on it.
Let's see how to use rbspy on a live process that runs in a Kubernetes Pod. First we need to know that rbspy relies on ptrace(3). To run a ptrace-enabled container, we need to give a container the SYS_PTRACE privilege. See securityContext.capabilities field in the Deployment spec:
apiVersion: extensions/v1beta1
kind: Deployment
metadata:
  name: secretland
  labels:
    app: secretland
spec:
  selector:
    matchLabels:
      app: secretland
  template:
    metadata:
      labels:
        app: secretland
    spec:
      containers:
      - image: kirshatrov/secretland:v1
        name: rails
        ports:
        - containerPort: 3000
        securityContext:
          capabilities:
            add:
            - SYS_PTRACE # <-- the privilege
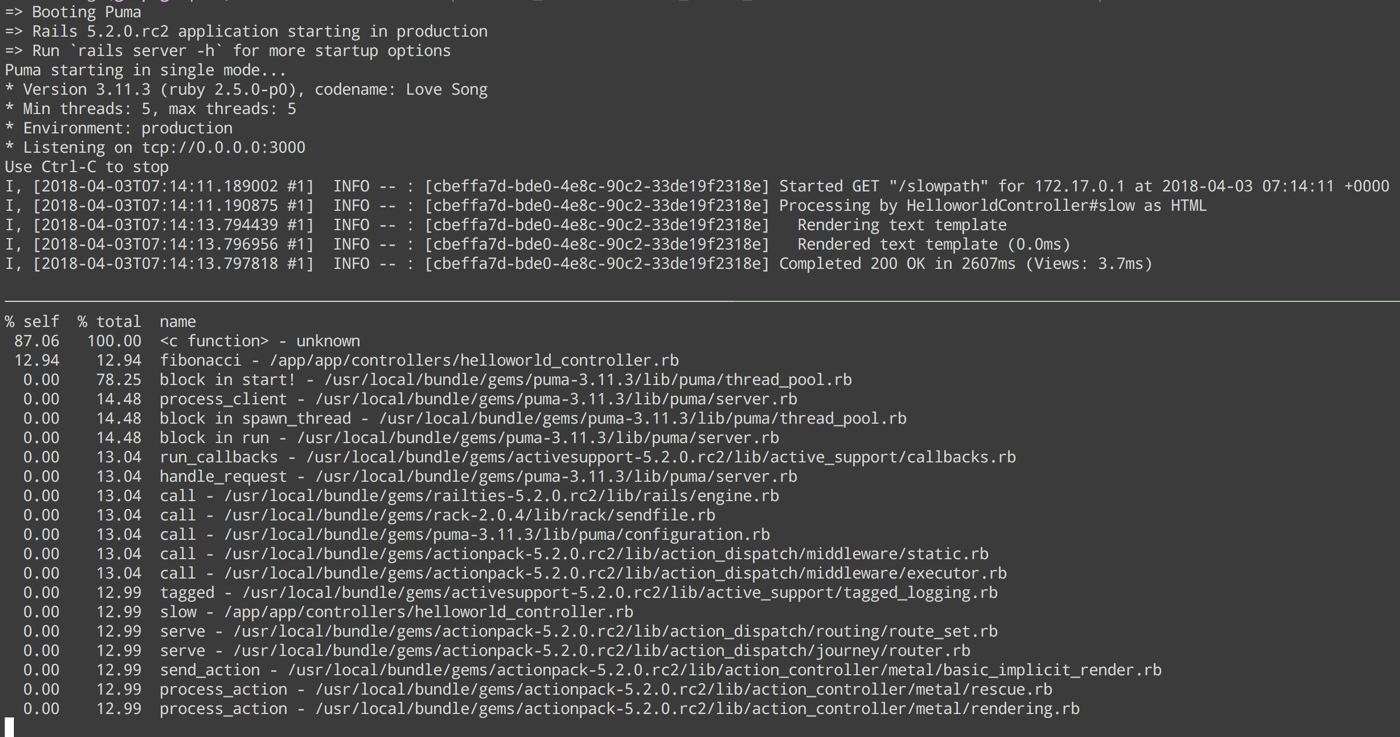
To emulate a slow endpoint, I've created a sample action that calculates Fibonacci number. That way, we'll be able to see where the process spends time in the Ruby land.
After the new Deployment spec is in place, we can exec to the web container and try rbspy. At least in my case, Puma process has pid equal 1.
$ kubectl exec -i -t secretland-8dc689458-jstp2 /bin/bash
root@secretland-8dc689458-jstp2:/app# rbspy record --pid 1
Time since start: 9s. Press Ctrl+C to stop.
Summary of profiling data so far:
% self  % total  name
100.00   100.00  <c function> - unknown
  0.00    79.41  block in start! - /usr/local/bundle/gems/puma-3.11.3/lib/puma/thread_pool.rb
  0.00    20.59  run_internal - /usr/local/bundle/gems/puma-3.11.3/lib/puma/reactor.rb
  0.00    20.59  block in run_in_thread - /usr/local/bundle/gems/puma-3.11.3/lib/puma/reactor.rb
The profile changes after I hit the /slowpath endpoint in browser:
% self  % total  name
 70.56   100.00  <c function> - unknown
 29.44    29.44  fibonacci - /app/app/controllers/helloworld_controller.rb
  0.00    67.89  block in start! - /usr/local/bundle/gems/puma-3.11.3/lib/puma/thread_pool.rb
  0.00    32.11  block in spawn_thread - /usr/local/bundle/gems/puma-3.11.3/lib/puma/thread_pool.rb
  0.00    30.97  process_client - /usr/local/bundle/gems/puma-3.11.3/lib/puma/server.rb
  0.00    30.97  block in run - /usr/local/bundle/gems/puma-3.11.3/lib/puma/server.rb
  0.00    29.44  tagged - /usr/local/bundle/gems/activesupport-5.2.0.rc2/lib/active_support/tagged_logging.rb
  0.00    29.44  slow - /app/app/controllers/helloworld_controller.rb
  0.00    29.44  serve - /usr/local/bundle/gems/actionpack-5.2.0.rc2/lib/action_dispatch/routing/route_set.rb
  0.00    29.44  serve - /usr/local/bundle/gems/actionpack-5.2.0.rc2/lib/action_dispatch/journey/router.rb
  0.00    29.44  send_action - /usr/local/bundle/gems/actionpack-5.2.0.rc2/lib/action_controller/metal/basic_implicit_render.rb
  0.00    29.44  run_callbacks - /usr/local/bundle/gems/activesupport-5.2.0.rc2/lib/active_support/callbacks.rb
  0.00    29.44  process_action - /usr/local/bundle/gems/actionpack-5.2.0.rc2/lib/action_controller/metal/rescue.rb
  0.00    29.44  process_action - /usr/local/bundle/gems/actionpack-5.2.0.rc2/lib/action_controller/metal/rendering.rb
  0.00    29.44  process_action - /usr/local/bundle/gems/actionpack-5.2.0.rc2/lib/action_controller/metal/params_wrapper.rb
  0.00    29.44  process_action - /usr/local/bundle/gems/actionpack-5.2.0.rc2/lib/action_controller/metal/instrumentation.rb
  0.00    29.44  process_action - /usr/local/bundle/gems/actionpack-5.2.0.rc2/lib/abstract_controller/callbacks.rb

Yay it works!
Getting to Docker
What if you need to get directly to the Docker daemon? Describe the pod, see what Node it's running on, then ssh to that instance.
$ kubectl describe pod secretland-8dc689458-jstp2 | grep Node
Node:           gke-kirs-jobs-default-pool-4a145b44-t690/10.128.0.3
Node-Selectors:  <none>

$ gcloud compute ssh gke-kirs-jobs-default-pool-4a145b44-t690 --zone us-central1-a

kir@gke-kirs-jobs-default-pool-4a145b44-t690 ~ $ docker ps
CONTAINER ID        IMAGE                                                                                                                    COMMAND                  CREATED             STATUS              PORTS               NAMES
fc10153238a0        kirshatrov/secretland@sha256:2e6d8341f51ebe7393d2a7c770c29fbaf959e3317b628d0dc5ebbb19c923d29c                            "rails server -b 0
I'm using Google Cloud, so instead of sshing directly I use gcloud compute ssh.
gdb
gdb might be useful for dumping MRI call stack, for instance when you want to find out why a Ruby process is stuck. See the script to dump call stack by my colleague Scott.
I haven't found a proper way to run gdb from a Kubernetes Pod yet, because gdb can't find Ruby's symbols:
$ kubectl exec -i -t secretland-8dc689458-jstp2 /bin/bash
root@secretland-8dc689458-jstp2:/app# ps aux
USER       PID %CPU %MEM    VSZ   RSS TTY      STAT START   TIME COMMAND
root         1  0.0  1.5 709816 58080 ?        Ssl  Apr07   0:08 puma 3.11.3 (tcp://0.0.0.0:3000) [app]
root        43  0.0  0.0  18204  3280 ?        Ss   02:29   0:00 /bin/bash
root        53  0.0  0.0  36636  2808 ?        R+   02:31   0:00 ps aux
root@secretland-8dc689458-jstp2:/app# gdb --pid 1
GNU gdb (Debian 7.12-6) 7.12.0.20161007-git
...
Attaching to process 1
[New LWP 6]
...
[New LWP 16]
[Thread debugging using libthread_db enabled]
Using host libthread_db library "/lib/x86_64-linux-gnu/libthread_db.so.1".
pthread_cond_wait@@GLIBC_2.3.2 () at ../sysdeps/unix/sysv/linux/x86_64/pthread_cond_wait.S:185
185     ../sysdeps/unix/sysv/linux/x86_64/pthread_cond_wait.S: No such file or directory.
Though I have a feeling that with the recent release of rbspy I won't need to use gdb much anymore, because 1) unlike gdb, rbspy doesn't pause the process 2) rbspy is way more user friendly.
Please share any snippets that you find helpful and I'll include them in the post.
